The platform · four capabilities

Forecasting, mapping, housing, AI — one fluent system.

Don't scroll past — click through each capability right here. Below, every tab opens into a full deep-dive section.

10.0k10.8k11.6k12.2kTODAY2018201920202021202220232024202520262027202820292030203120322033203420352035 FORECAST11,090±4.4%HistoricalAI ForecastWhat-if scenario

Forecasting

Grade-level forecasts with confidence bands. Ready in October.

97.9%
Model accuracy on backtests
01 · Enrollment Forecasting

A living forecast that arrives when you actually need it.

We transform a costly, static consulting project into a dynamic, AI-driven platform.

Grade-level forecasts with an intelligent policy layer. The model retrains as your district changes — and lets you instantly run what-if scenarios for boundary shifts, program relocations, and capacity planning.

  • October-ready
    Forecasts arrive at the start of the year, not the end of it.
  • Grade-level granularity
    Drill from district to school to individual grade with confidence bands.
  • Unlimited what-ifs
    Model boundary, program, and capacity scenarios on the fly.
10.0k10.8k11.6k12.2kTODAY2018201920202021202220232024202520262027202820292030203120322033203420352035 FORECAST11,090±4.4%HistoricalAI ForecastWhat-if scenario
02 · Boundaries & Mapping

Navigating complex district changes with confidence.

Modifying attendance boundaries and consolidating schools are among the most challenging, politically sensitive projects a district leader undertakes — yet often essential for the long-term well-being of students and community.

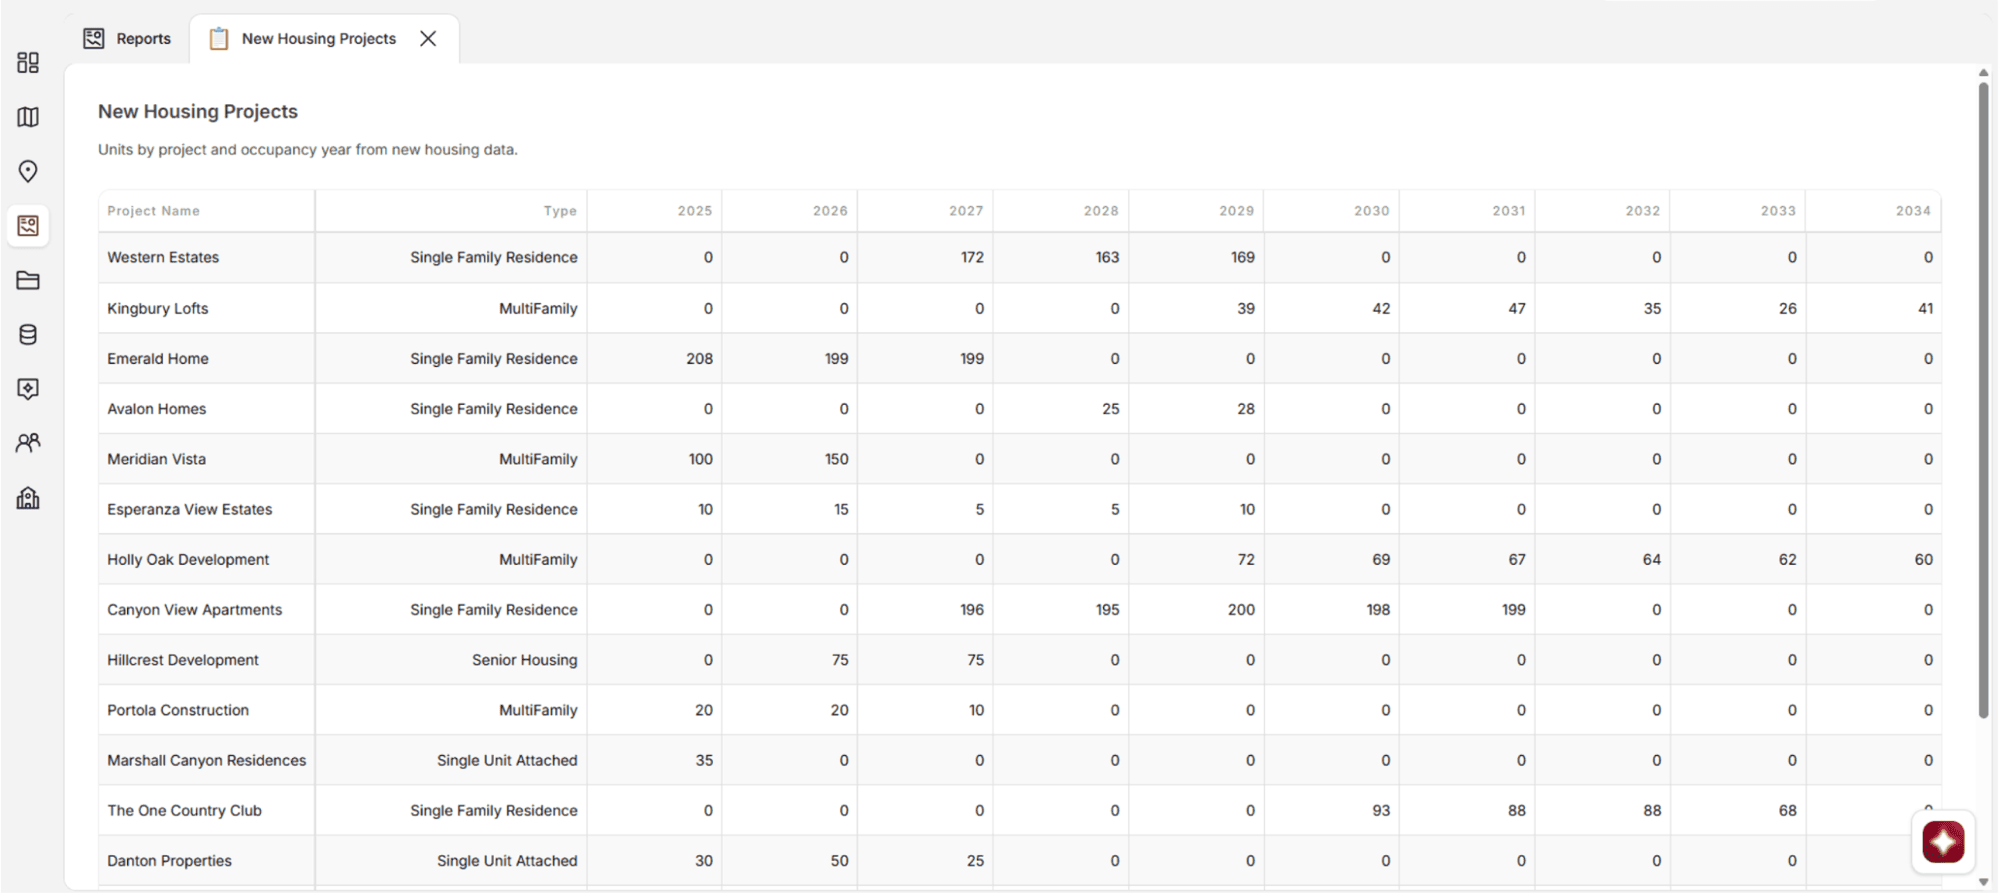
The EnrollCast platform provides a comprehensive suite of tools to evaluate new boundary options seamlessly. Run a multitude of “what-if” scenarios to instantly determine project viability — turning a process that used to take weeks into one that takes minutes. By coupling interactive mapping with our AI/ML forecasting engine, you see exactly how today’s choices will impact tomorrow’s classrooms.

  • Visualize instantly
    Rapidly modify boundaries directly on the map.
  • Forecast accurately
    Generate new 10-year projections for specific schools or the whole district.
  • Plan long-term
    See exactly how your boundary changes play out over the next decade.
EnrollCast map workspace: a draft boundary selection with 49 students across 3 schools, broken down by school.
03 · New Housing Data

Automated importation of new housing data.

EnrollCast is the first enrollment forecasting platform to fully automate the tracking and importation of new residential developments within your district.

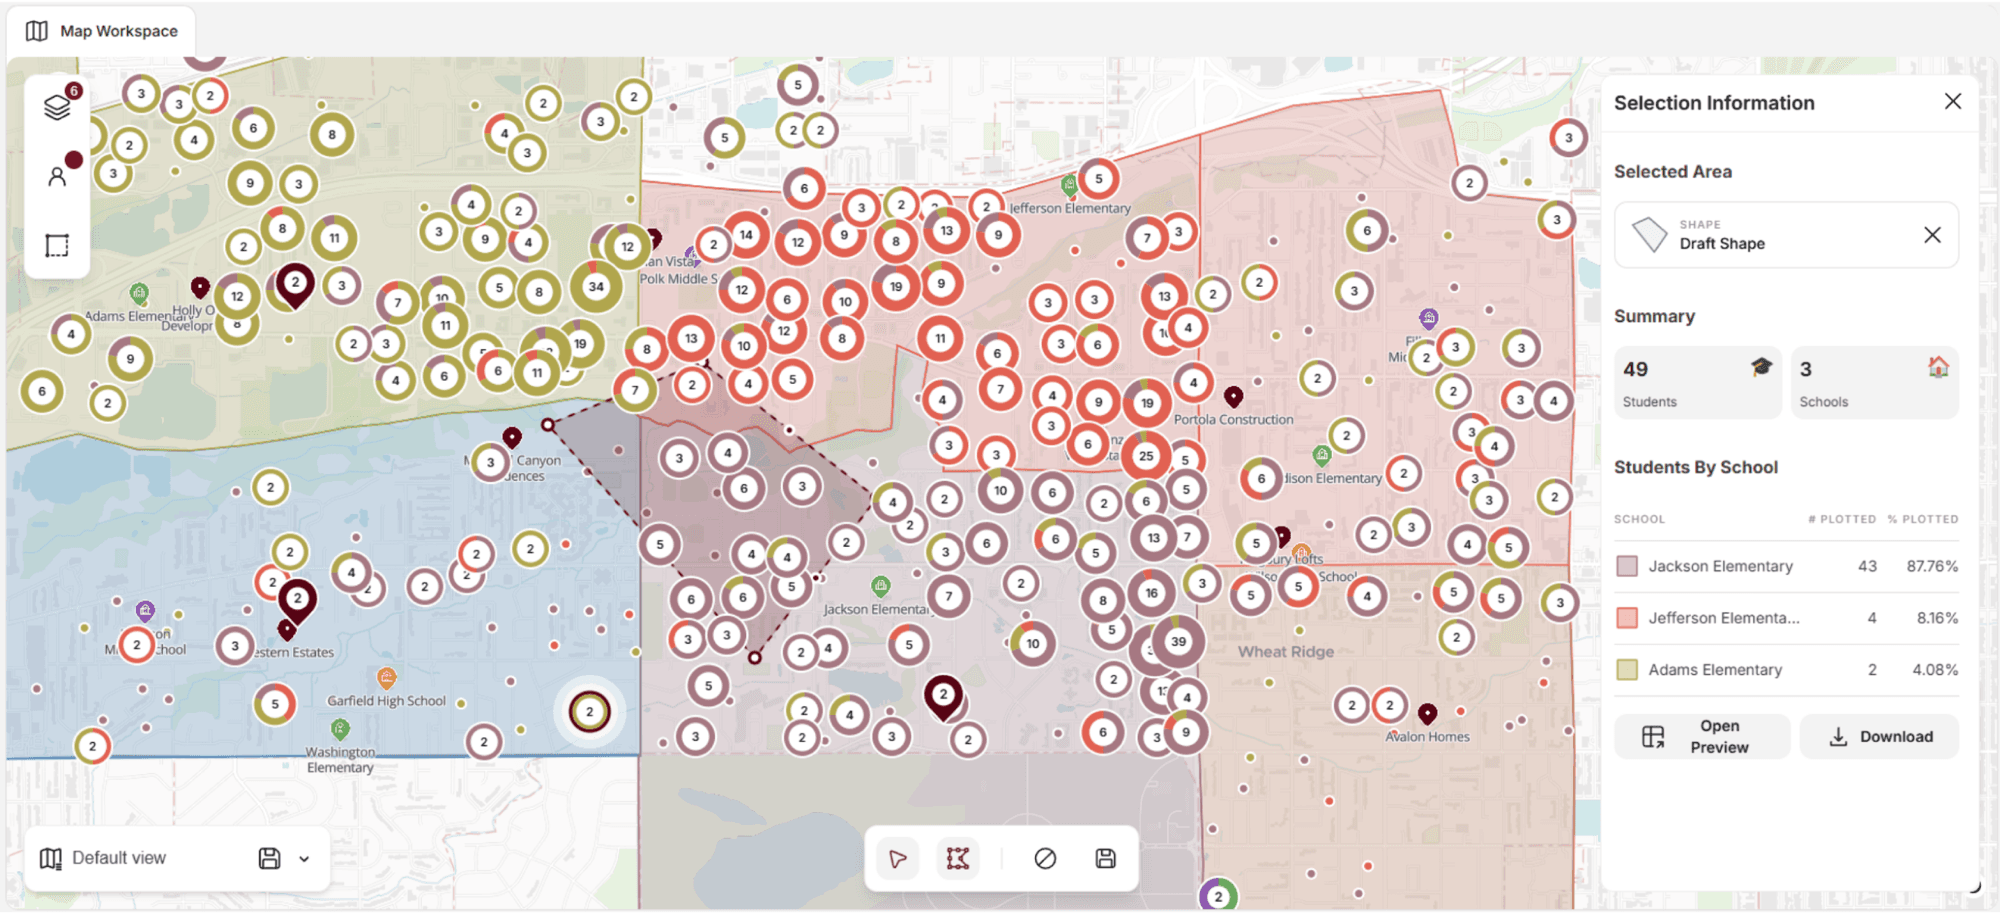
New housing can dramatically shift enrollment patterns, so quantifying its impact is crucial to an airtight forecast. Every quarter, our platform pulls new housing permit data directly from your local planning agencies, maps where projects are located, identifies exactly which schools will be affected, and folds the impact into your forecasts — with a robust suite of diagnostic reports.

  • Permit-level coverage
    Plans, breaks ground, occupies — we capture each stage.
  • Normalized and ready
    Run alternate new-housing scenarios and understand the what-ifs of your growth, on demand.
  • Auto-refreshes
    When projects change, you’re automatically updated and can choose to update your projections.
EnrollCast New Housing Projects report: units by project, type, and occupancy year from 2025 to 2034.
04 · AI Assistant

Your on-demand demographic analyst.

Our AI assistant acts as an on-demand demographic data analyst — eliminating the need to hunt through dense reports for answers. Simply ask your questions in plain English.

Because we built explainability directly into our model, you won’t just get data; you’ll clearly understand the why behind your district’s enrollment shifts.

  • Easily respond to board or community questions
    Let AI handle the heavy analytical lifting so you get immediate, accurate answers and reclaim valuable time in your busy day.
  • Siloed and secure
    Your district's data stays in your district's instance.
  • Cross-source answers
    Pulls from forecasts, housing, policy, and history — together.
EnrollCast AI · siloed instance
If we shift Lincoln Elementary's east boundary to Oak St., how does kindergarten capacity change in 2027?
Lincoln K capacity drops from 92% utilization to 71%. Jefferson K rises to 104% — over capacity. Three blocks (1244 students total) reassigned.
Lincoln K
71%
-21pp
Jefferson K
104%
+18pp
Reassigned
1,244
3 blocks
Foundations

Modern, secure, and built for the way districts actually work.

Cloud-native

No local installs, no IT lift. Access from any browser.

District-secure

Siloed data environment with strict access controls.

Proprietary data

Demographic + housing pipelines you can't get anywhere else.

Seasoned support

Direct support from veterans of 100+ boundary processes.

Walk into your next board meeting with answers.

Book a discovery call with our team. We'll show you a forecast built on your district's real history in under 30 minutes.

Discovery call
30 min
Personalized demo
Same week
We respond to every inquiry
1 day